Total Pageviews

Sunday, July 10, 2016

Mean, Mode, Median

 Mean, Median, Mode


     Mean:
                      -- Also known as the average.  The mean is found by adding up all of the given data and
             dividing by the number of data entries.
                Example:
                             - the grade 10 math class recently had a mathematics test and the grades were as
                               follows:
                                       78
                                       66
                                       82                                  464 / 6 = 77.3
                                       89
                                       75                        Hence, 77.3 is the mean average of the class.
                                    + 74
                                      464
     Median:
                      -- The median is the middle number.  First you arrange the numbers in order from lowest
                to highest, then you find the middle number by crossing off the numbers until you reach the
                middle.
              Example:
                               - use the above data to find the median:
                                                66  74  75  78  82  89\
                            - as you can see we have two numbers, there is no middle number.  What do we do?
                   It is simple; we take the two middle numbers and find the average, ( or mean ).
                                                             75 + 78 = 153
                                                              153 / 2 = 76.5
                             Hence, the middle number is 76.5.
         Mode:
                        -- this is the number that occurs most often.
                 Example:
                                 - find the mode of the following data:
                                    78  56  68  92  84  76  74  56  68  66  78  72  66
                                    65  53  61  62  78  84  61  90  87  77  62  88  81
                                                   The mode is  78. 


https://www.youtube.com/watch?v=IV_m_uZOUgI


References:


Probability

Probability

How likely something is to happen.
Many events can't be predicted with total certainty. The best we can say is how likely they are to happen, using the idea of probability.
 

Tossing a Coin 

When a coin is tossed, there are two possible outcomes:
  • heads (H) or
  • tails (T)
We say that the probability of the coin landing H is ½.
And the probability of the coin landing T is ½.
pair of dice 

Throwing Dice 

When a single die is thrown, there are six possible outcomes: 1, 2, 3, 4, 5, 6.
The probability of any one of them is 1/6.

Probability 

In general:
Probability of an event happening = Number of ways it can happenTotal number of outcomes

Example: the chances of rolling a "4" with a die

Number of ways it can happen: 1 (there is only 1 face with a "4" on it)
Total number of outcomes: 6 (there are 6 faces altogether)
So the probability = 16

Example: there are 5 marbles in a bag: 4 are blue, and 1 is red. What is the probability that a blue marble gets picked?

Number of ways it can happen: 4 (there are 4 blues)
Total number of outcomes: 5 (there are 5 marbles in total)
So the probability = 45 = 0.8

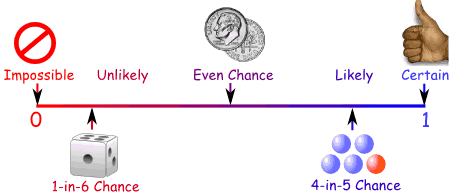
Probability Line

We can show probability on a Probability Line:
Probability is always between 0 and 1

Probability is Just a Guide

Probability does not tell us exactly what will happen, it is just a guide

Example: toss a coin 100 times, how many Heads will come up?

Probability says that heads have a ½ chance, so we can expect 50 Heads.
But when we actually try it we might get 48 heads, or 55 heads ... or anything really, but in most cases it will be a number near 50.
Words
Some words have special meaning in Probability:
Experiment or Trial: an action where the result is uncertain.
Tossing a coin, throwing dice, seeing what pizza people choose are all examples of experiments.
Sample Space: all the possible outcomes of an experiment

Example: choosing a card from a deck

There are 52 cards in a deck (not including Jokers)
So the Sample Space is all 52 possible cards: {Ace of Hearts, 2 of Hearts, etc... }
The Sample Space is made up of Sample Points:
Sample Point: just one of the possible outcomes

Example: Deck of Cards

  • the 5 of Clubs is a sample point
  • the King of Hearts is a sample point
"King" is not a sample point. As there are 4 Kings that is 4 different sample points.

Event: a single result of an experiment

Example Events:

  • Getting a Tail when tossing a coin is an event
  • Rolling a "5" is an event.
An event can include one or more possible outcomes:
  • Choosing a "King" from a deck of cards (any of the 4 Kings) is an event
  • Rolling an "even number" (2, 4 or 6) is also an event

 
The Sample Space is all possible outcomes.
A Sample Point is just one possible outcome.
And an Event can be one or more of the possible outcomes.

Hey, let's use those words, so you get used to them:
pair of dice

Example: Alex wants to see how many times a "double" comes up when throwing 2 dice.

Each time Alex throws the 2 dice is an Experiment.
It is an Experiment because the result is uncertain.

The Event Alex is looking for is a "double", where both dice have the same number. It is made up of these 6 Sample Points:
{1,1} {2,2} {3,3} {4,4} {5,5} and {6,6}

The Sample Space is all possible outcomes (36 Sample Points):
{1,1} {1,2} {1,3} {1,4} ... {6,3} {6,4} {6,5} {6,6}

These are Alex's Results:
ExperimentIs it a Double?
{3,4}No
{5,1}No
{2,2}Yes
{6,3}No
...
References:


Data

What is Data?

Data is a collection of facts, such as numbers, words, measurements, observations or even just descriptions of things.

Qualitative vs Quantitative

Data can be qualitative or quantitative.
  • Qualitative data is descriptive information (it describes something)
  • Quantitative data, is numerical information (numbers).
Types of Data
And Quantitative data can also be Discrete or Continuous:
  • Discrete data can only take certain values (like whole numbers)
  • Continuous data can take any value (within a range)
Put simply: Discrete data is counted, Continuous data is measured

Example: What do we know about Arrow the Dog?

Arrow the Dog
Qualitative:
  • He is brown and black
  • He has long hair
  • He has lots of energy
Quantitative:
  • Discrete:
    • He has 4 legs
    • He has 2 brothers
  • Continuous:
    • He weighs 25.5 kg
    • He is 565 mm tall
To help you remember think "Quantitative is about Quantity"

More Examples

Qualitative:
  • Your friends' favorite holiday destination
  • The most common given names in your town
  • How people describe the smell of a new perfume
Quantitative:
  • Height (Continuous)
  • Weight (Continuous)
  • Petals on a flower (Discrete)
  • Customers in a shop (Discrete)

Collecting

Data can be collected in many ways. The simplest way is direct observation.
Example: you want to find how many cars pass by a certain point on a road in a 10-minute interval.
So: stand at that point on the road, and count the cars that pass by in that interval. 
We collect data by doing a Survey.

Census or Sample

Census is when we collect data for every member of the group (the whole "population").
Sample is when we collect data just for selected members of the group.
Example: there are 120 people in your local football club.
You can ask everyone (all 120) what their age is. That is a census.
Or you could just choose the people that are there this afternoon. That is a sample.
A census is accurate, but hard to do. A sample is not as accurate, but may be good enough, and is a lot easier.

Language


Data or Datum?

The singular form is "datum", so we say "that datum is very high"."Data" is the plural so we say "the data are available", but it is also a collection of facts, so "the data is available" is fine too.
References:

Squence & Number Pattern

Squence & Number Pattern


In Order
When we say the terms are "in order", we are free to define what order that is! They could go forwards, backwards ... or they could alternate ... or any type of order we want!

Like a Set


A Sequence is like a Set, except:
  • the terms are in order (with Sets the order does not matter)
  • the same value can appear many times (only once in Sets)


    Notation
    Sequences also use the same notation as sets:
    list each element, separated by a comma,
    and then put curly brackets around the whole thing.
    {3, 5, 7, ...}


    That nearly worked ... but it is too low by 1 every time, so let us try changing it to:
                                        Test Rule: 2n+1


    So instead of saying "starts at 3 and jumps 2 every time" we write this:
    2n+1
    Now we can calculate, for example, the 100th term:
    2 × 100 + 1 = 201


    Arithmetic Sequences


    An Arithmetic Sequence is made by adding the same value each time.

    Example:

    1, 4, 7, 10, 13, 16, 19, 22, 25, ...
    This sequence has a difference of 3 between each number.
    The pattern is continued by adding 3 to the last number each time, like this:

    Example:

    3, 8, 13, 18, 23, 28, 33, 38, ...
    This sequence has a difference of 5 between each number.
    The pattern is continued by adding 5 to the last number each time, like this:
    The value added each time is called the "common difference"
    What is the common difference in this example?
    19, 27, 35, 43, ...

    Answer: The common difference is 8
    The common difference could also be negative:

    Example:

    25, 23, 21, 19, 17, 15, ...
    This common difference is −2
    The pattern is continued by subtracting 2 each time, like this:
                 Geometric Sequences

    Geometric Sequence is made by multiplying by the same value each time.

    Example:

    1, 3, 9, 27, 81, 243, ...
    This sequence has a factor of 3 between each number.
    The pattern is continued by multiplying by 3 each time, like this:
    What we multiply by each time is called the "common ratio".
    In the previous example the common ratio was 3:
    We can start with any number:

    Example: Common Ratio of 3, But Starting at 2

    2, 6, 18, 54, 162, 486, ...
    This sequence also has a common ratio of 3, but it starts with 2.

    Example:

    1, 2, 4, 8, 16, 32, 64, 128, 256, ...
    This sequence starts at 1 and has a common ratio of 2.
    The pattern is continued by multiplying by 2 each time, like this:
    The common ratio can be less than 1:

    Example:

    10, 5, 2.5, 1.25, 0.625, 0.3125, ...
    This sequence starts at 10 and has a common ratio of 0.5 (a half).
    The pattern is continued by multiplying by 0.5 each time.
    But the common ratio can't be 0, as we would get a sequence like 1, 0, 0, 0, ...


    References:


    Monday, June 27, 2016

    Arithmetic & Geometric progression

    Arithmetic&Geometric progression

     In mathematics, an arithmetic progression (AP) or arithmetic sequence is a sequence of numbers such that the difference between the consecutive terms is constant. For instance, the sequence 5, 7, 9, 11, 13, 15 … is an arithmetic progression with common difference of 2.
    If the initial term of an arithmetic progression is  and the common difference of successive members is d, then the nth term of the sequence () is given by:
    and in general
    A finite portion of an arithmetic progression is called a finite arithmetic progression and sometimes just called an arithmetic progression. The sum of a finite arithmetic progression is called an arithmetic series.
    The behavior of the arithmetic progression depends on the common difference d. If the common difference is:
    • Positive, then the members (terms) will grow towards positive infinity.
    • Negative, then the members (terms) will grow towards negative infinity.

    geometric progression

    n.
    sequence, such as the numbers 1, 3, 9, 27, 81, in which each term is multiplied by the same factor in order to obtain the following term. Also called geometric sequence.

    A sequence of numbers in which each number is multiplied by the same factor to obtain the next number in the sequence; a sequence in which the ratio of any two adjacent numbers is the same. An example is 5, 25, 125, 625, ..., where each number is multiplied by 5 to obtain the following number, and the ratio of any number to the next number is always 1 to 5. Compare arithmetic progression.


    Examples


    https://www.youtube.com/watch?v=gua96ju_FBk


    References: